STUDY OF TMAZ
PHYSICO CHEMICAL STUDY OF TMAZ
Nitrogen physisorption.
INTRODUCTION
This technique allows the study of porous material, thanks to the calculation of:
RESULTS
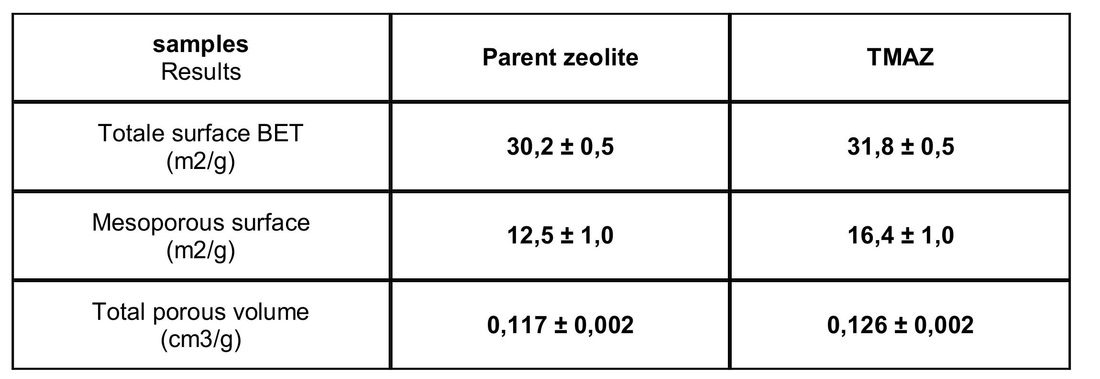
Differentiation of the clinoptilolite zeolite treated by tribomechanical micronization in comparison with the zeolite treated by a classical grinding.
→ +31.2 % of mesoporous surface.
INTRODUCTION
This technique allows the study of porous material, thanks to the calculation of:
- The specific surface: measurement of the total surface, accessible by the nitrogen molecule, reported to the mass unity (m²/g), by BET method.
- The porous volume: volume of accessible pores, reported to the mass unity.
- Pores diameters and their distribution
RESULTS
Differentiation of the clinoptilolite zeolite treated by tribomechanical micronization in comparison with the zeolite treated by a classical grinding.
→ +31.2 % of mesoporous surface.
Chemical analysis by MEB.
INTRODUCTION
This technique is used for the observation of the surface state of material. It is very efficient for the detection of material defaults (holes, fissure...)
An electron beam sweeps the surface of the material which must be analysed. It allows to build the image “point by point” by the detection of secondary electrons, going out of the matter. This kind of scanning is made under vacuum, and under the action of an electric current.
RESULTS
Sample TMAZ
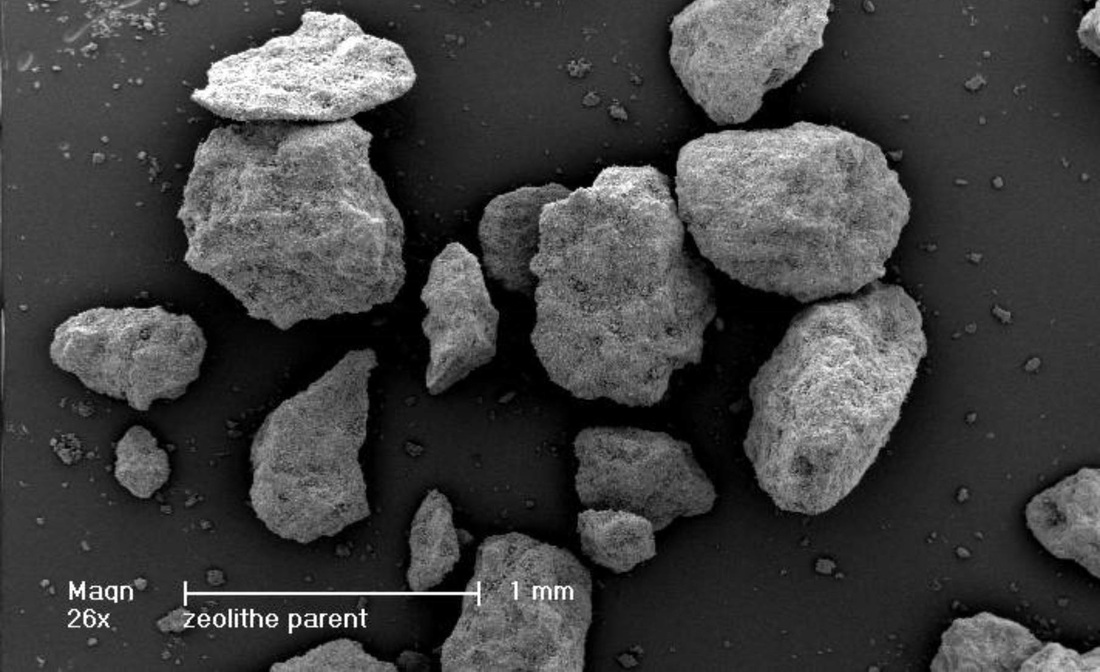
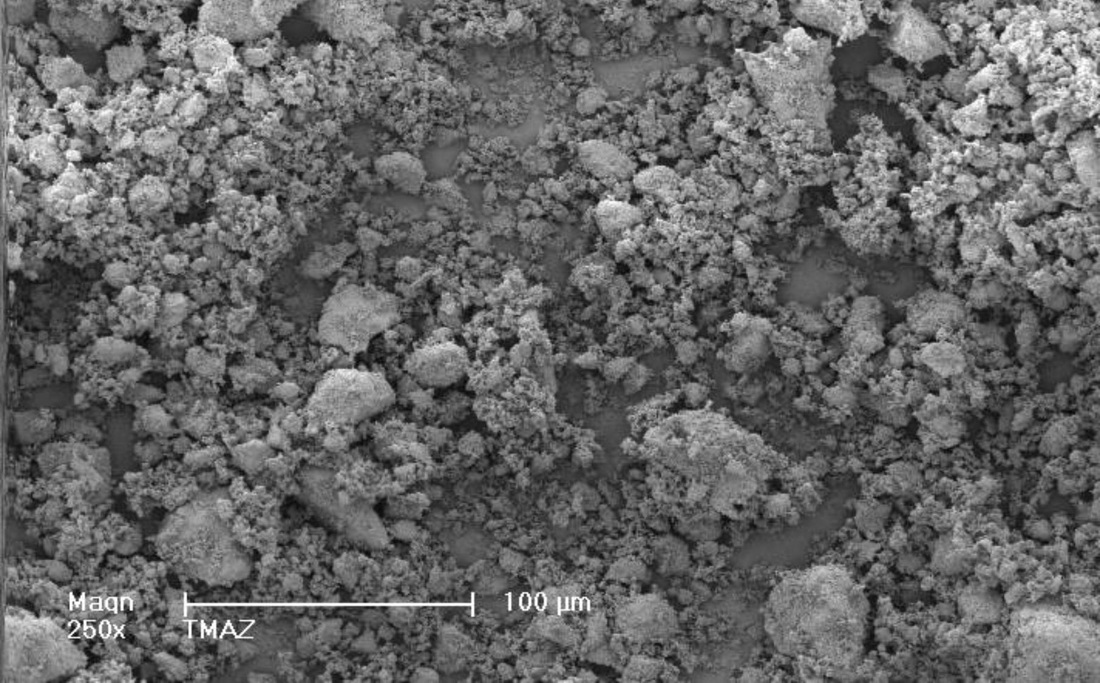
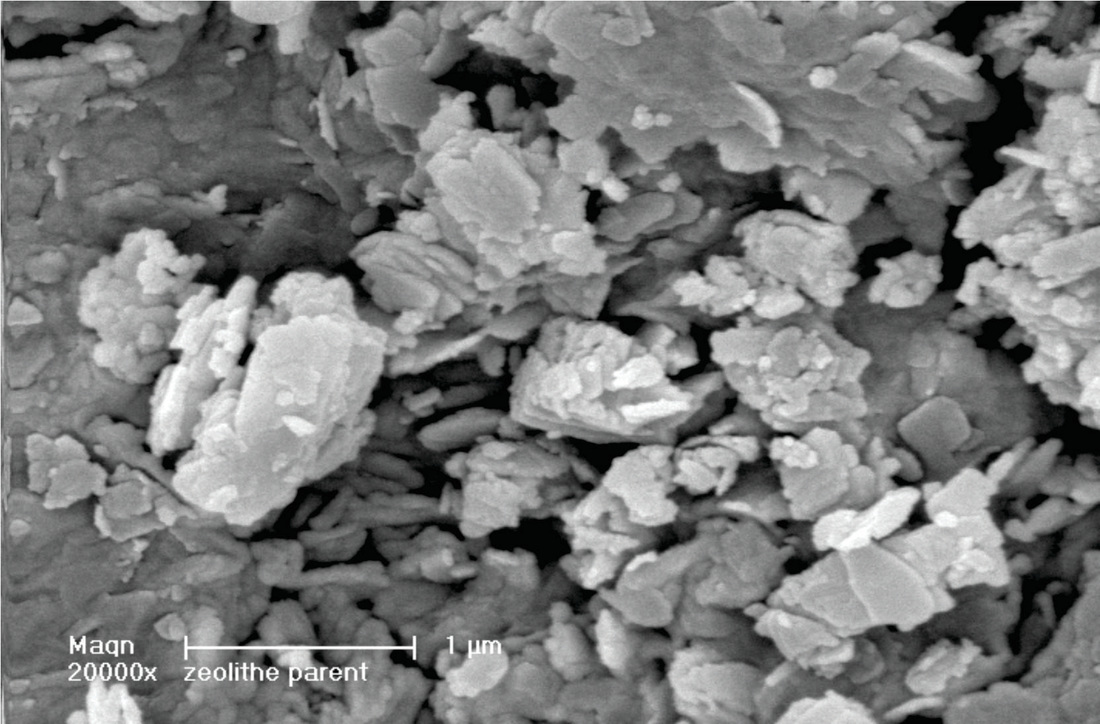
The sample is made of aggregates without any particular forms. With a big magnification, it seems that the surface of the aggregates is dotted with plaques of 100 µm to 1 µm (Picture 1) with length and thickness less than 50 nm. (Picture 2)
No geometric form characteristic of crystalline structures is visible.
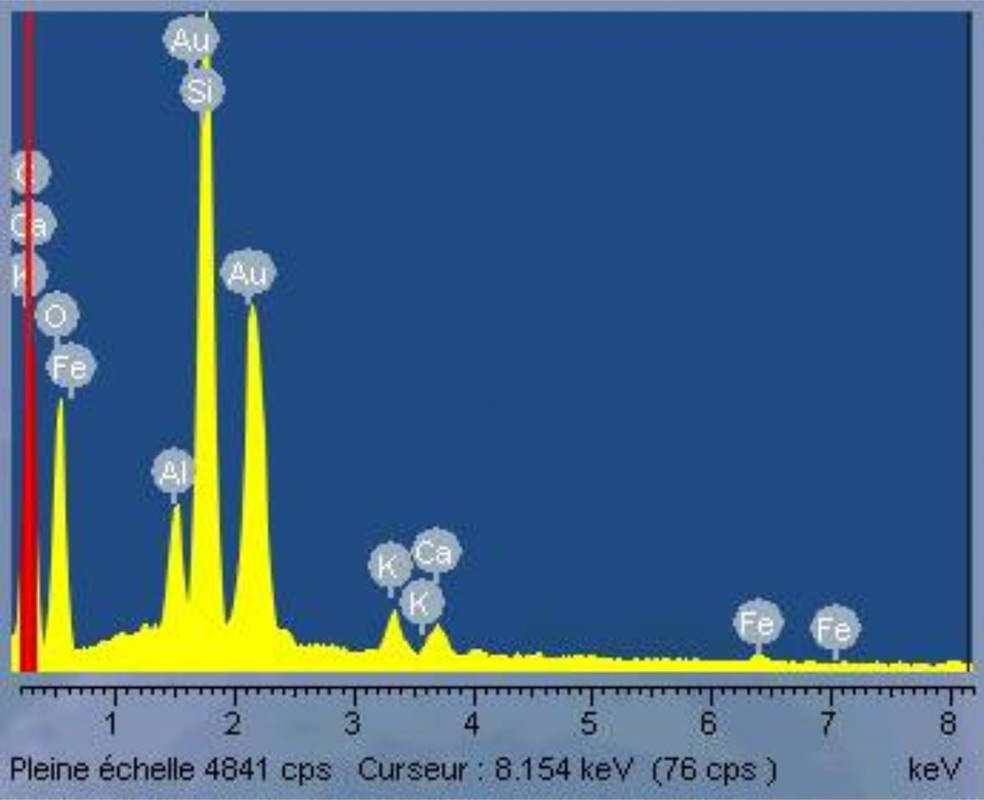
A qualitative analysis by EDX microprobe has been made on an aggregate.
A cartography of the main elements Al, Si, O, Ca, K and Fe was obtained and allow to conclude that the distribution of each element seem to be homogeneous on the surface of the sample.
EDX spectre corresponding to the parent zeolite taking: distribution cartography of the main elements contained in parent zeolite obtained by EDX microprobe.
Zeolite TMAZ
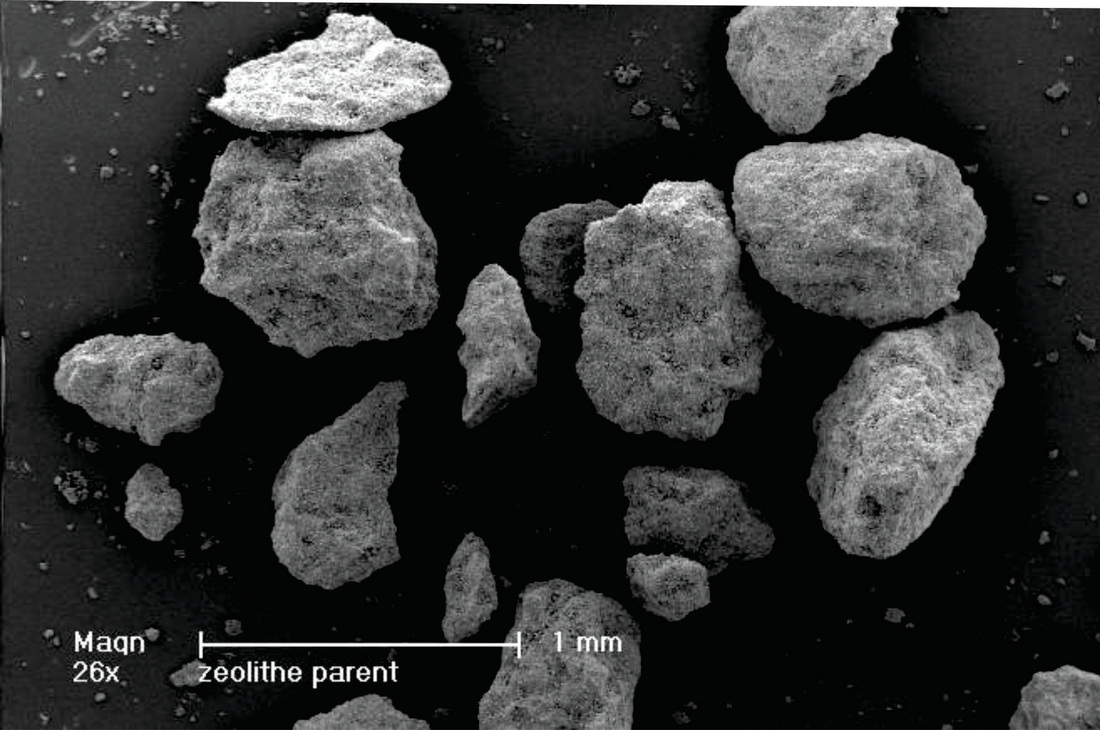
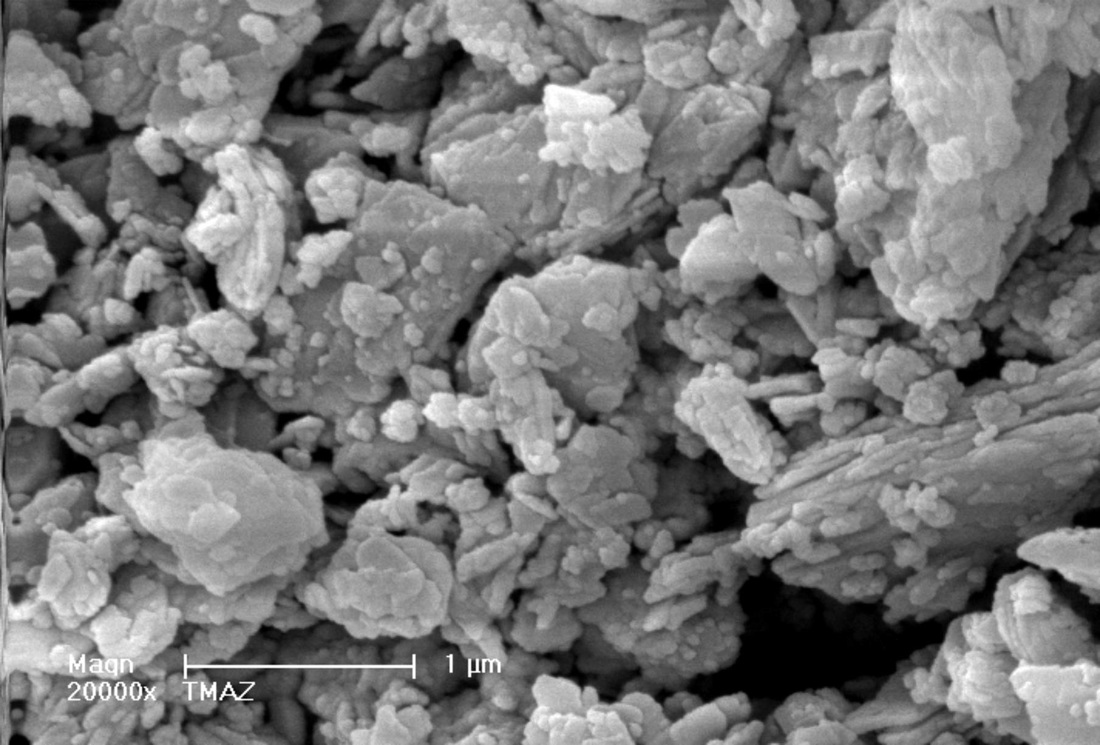
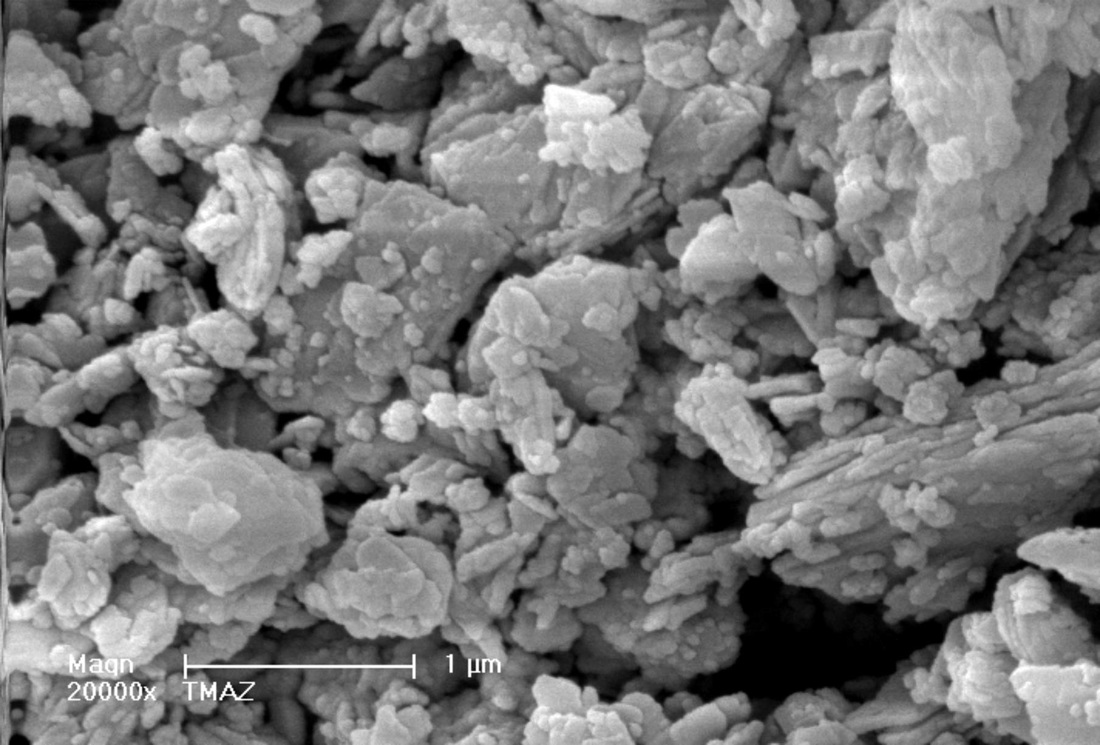
Aggregates are smaller but the sizes are more varied. Those aggregates have a size from 80 µm for the bigger one to few µm for the smaller one. With a big magnification, we can see the presence of plaques piling up. (Picture 3) Those are the same than the one of the parent zeolite. (Picture 4)
Conclusion
In both studied samples, plaques are the only crystalline form. Mechanical grinding did not seem to have an effect on the bursting of the big aggregates.
3. X fluorescence chemical analysis
INTRODUCTION
X fluorescence spectrometry is an analytic technique for the identification and determination of the elements present in a liquid or solid sample. The sample is places in a X rays beam. It will reemit itself the X rays, that is to say the fluorescence. On an energy spectre, there are different characteristic peaks of all present elements. The height of the peaks allows to determine the quantity of each elements.
RESULTS
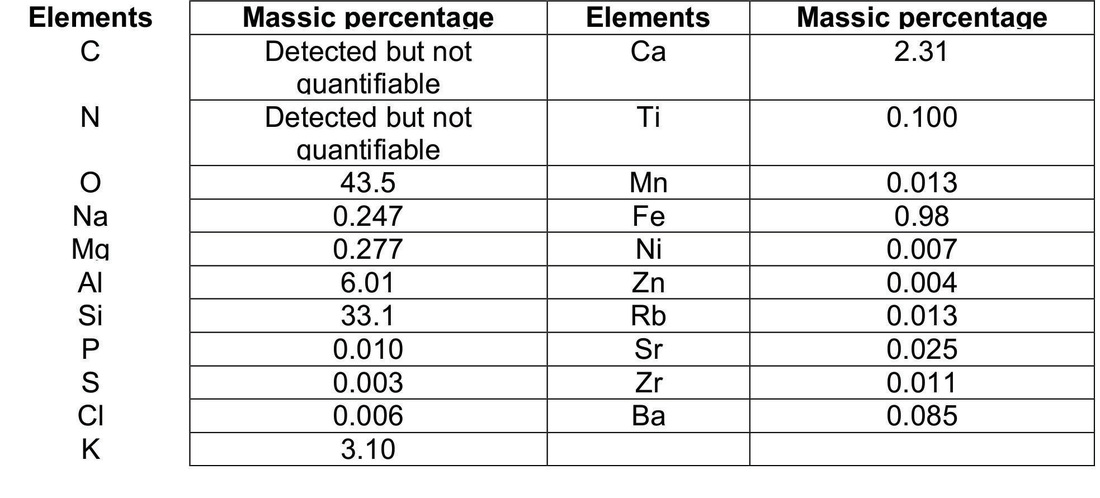
- comparison between TMAZ and HCl treated TMAZ
Table 1: HCl treated TMAZ
Humidity and fire loss have been studied by thermogravimetry. Humidity is hard to determine because the loss is continue between 25 and 600 °, but it is in the region of 6.5 % for t < 200 °. The total fire loss is 11.5 %.
The total % analysed by X fluorescence around 89.8 % is due to a fire loss, less than the one obtained for the initial product (22.9 %). As the fire losses are different for both products, we cannot compare the results directly. If the acid treatment did not dissolve silicium, molar ratio of the different elements in comparison with this one will allow us to evaluate the treatment acid influence.
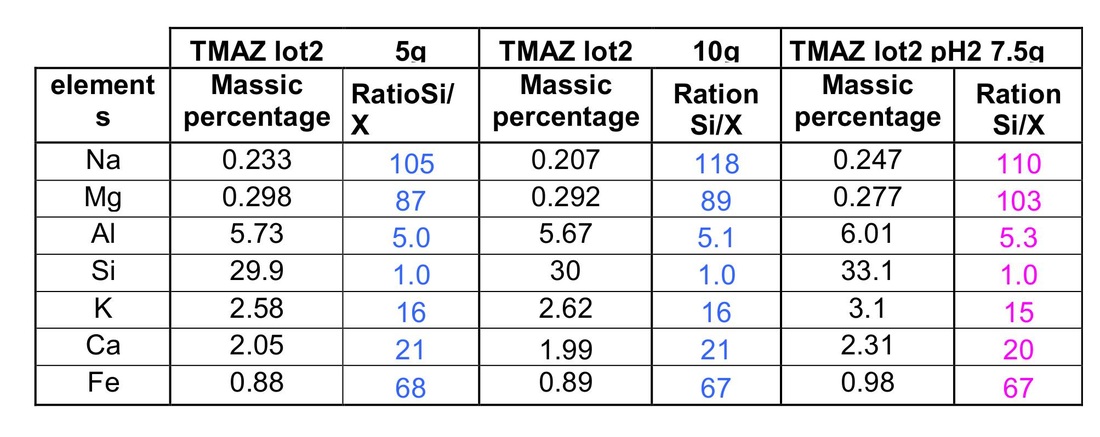
Study was made first on the main elements of the sample. The ratio silicium/elements was calculated and compared to the both analyses made on TMA before treatment.
Table 2: comparison of molar ratio for the main elements
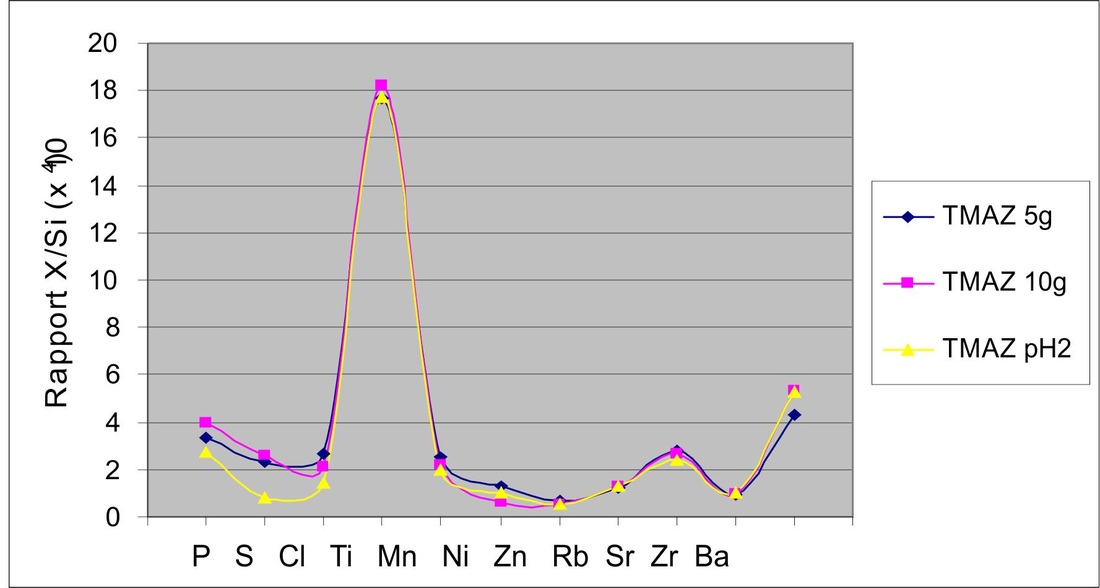
For the trace element, element/silicium ratios are studied and compared to the initial sample.
For most of the elements, ratios are similar and are in the error range, in comparison with the initial sample. There are only 3 elements (P, S, Cl) which have a decreased ratio, and seem to be dissolve by acid.
For most of the elements, ratios are similar and are in the error range, in comparison with the initial sample. There are only 3 elements (P, S, Cl) which have a decreased ratio, and seem to be dissolve by acid.
Conclusion
Acid treatment did not dissolve Al and there are just the concentrations of 3 trace elements which are diminished.
4. X rays diffraction analysis
INTRODUCTION
This technique allows identification, especially their crystallised phases. It allows a complete determination of the structure, that is to say the distribution and the position of each type of atome.
RESULTS
The formula of the clinoptilolite given by the apparatus is:
(Na0.52K2.44Ca0.48) (Al6.59Si29.41O72) (H2O)28.64.
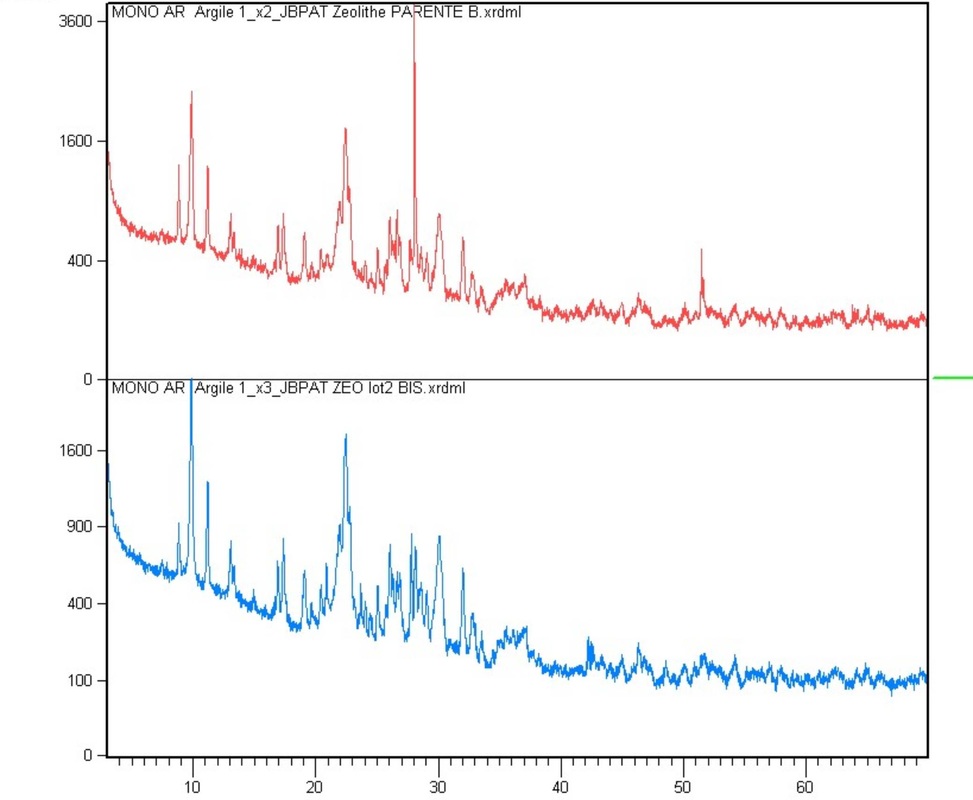
The parent zeolite diffractogramm was obtained from the grinded sample.
The comparison of the diffractogramm shows the differences about the intensity of some peaks:
Contact. |
|
Proudly powered by Weebly

